DEFINING REGIONS:
A TEACHING STRATEGY
|
Overview
Main Ideas
One of the most stimulating activities for
students is for them to create their own
maps and then to try to decide what those
maps mean. There is the fun of watching
geographical patterns emerge, and there is
the intellectual challenge of explaining these
patterns. The concept of region is
explained, and material is provided so that
students can create their own regions.
There are no right or wrong answers. The
success of the exercise must be measured
by the extent to which it stimulates debate
on regions, discussion of cause and effect,
and interest in Illinois history.
The "historic present" is a useful
method by which geography and history can
be combined in the classroom. To discover
the unique character of an area in this
case Illinois at a particular time in this
case 1870 one needs some basic facts,
a willingness to think in terms of what was
really important to people at that period, and
a little imagination. Here are some of the
things that might be important in interpreting
the maps that the students will create.
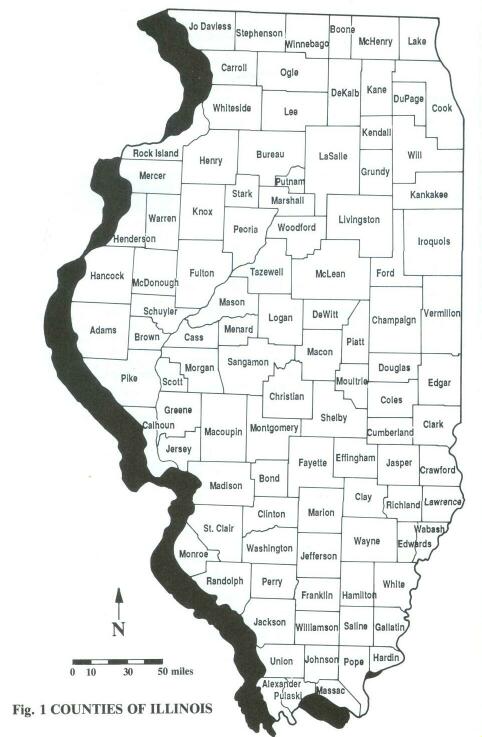
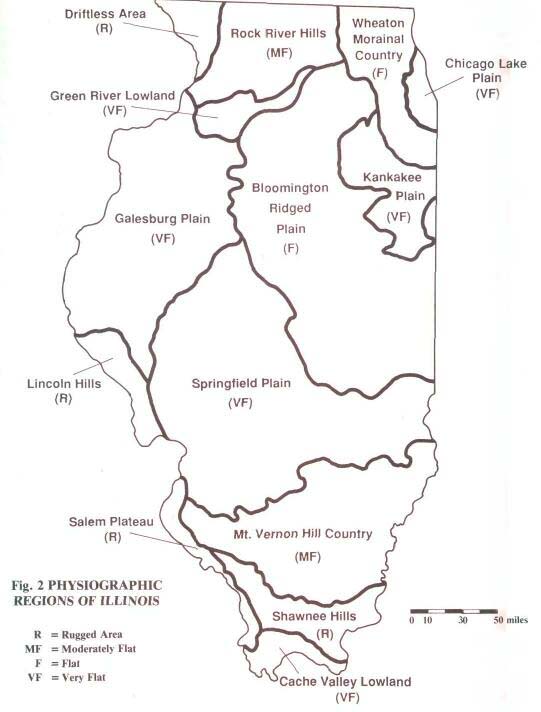
Illinois is basically a flat state (see Figure1);
there are only four fairly small areas where
bedrock dominates, and most of that land is
too rocky and hilly for much farming: the
Galena country in the northwest, the Lincoln
Hills in Calhoun and southern Pike County,
the Salem Plateau in the southwest, and the
Shawnee Hills in the far south.
Illinois was settled by quite different
groups. Upland Southerners came from
Kentucky and Tennessee and moved north,
while settlers from the eastern states came
somewhat later and generally moved from
east to west. Of the last group, the New
Englanders who settled the northernmost
counties of the state were perhaps the most
different from the Upland Southerners.
48
Until a few years before 1870 you
could not farm until you put up a fence to
keep out the neighbors' livestock, which did
not have to be fenced in; this meant that
trees for fences were essential for settlement, and it helps to explain why the last
area in Illinois to be settled was the treeless
Grand Prairie. Substantial parts of that zone
had yet to be occupied in 1870. Many of the
larger river valleys in Illinois are lined with
rocky cliffs or swampy lowlands, which presented problems for farmers. Growing seasons in Illinois become shorter as one goes
north, which in turn influenced the selection
of crops. Corn was already the biggest
money-making crop in Illinois in 1870, and
huge amounts were being shipped to other
states and countries. However, almost all
farm work was done with the aid of horses,
requiring farmers everywhere in Illinois to
devote a large number of acres to oats to
feed their work animals. The railroad network was making rapid progress in Illinois,
but many areas were not yet served.
Chicago had grown extremely rapidly
between 1850 and 1870, and in 1870.
Chicago was the only really large city in the
state. In 1870 most people in Illinois lived
on farms, and except perhaps in Cook
County, population changes between 1860
and 1870 depended on changes in farming.
Remember too, that the southern part of the
state was settled first, so those counties
generally had less room for new farms than
did those in the north.
Connection with the Curriculum
Focusing on the region can facilitate an
emphasis on higher level thinking. Students
must process a great deal of information in
the analysis of a variety of topics. Synthesis
occurs when they attempt to understand the
interrelationships of those topics and arrive
at composite pictures of unique regions.
Employing the temporal dimension of history and the spatial dimension of geography
offers a powerful combination by which students can understand a part of their world.
Teaching Level
Grades 7-12
Materials for Each Student
U.S. outline map
1870 data
Illinois base map (with counties
labeled)
Illinois physiographic map
Colored pencils or markers (optional)
49
Identification of data categories:
- Population per square mile
- % population growth, 1860-1870
- % area in improved land
- % woodland
- % farms of 100 or more acres
- % farms of fewer than 50 acres
- % of total crop production in corn.
(Note: Oats dominant in Boone, Cook, DeKalb,
Du Page, Kane, Kankakee, Lake, and Will. Wheat
dominant in Jersey, Monroe, Randolph, and
St. Clair.)
- $ value of market gardening per square mile
- $ value of orchard products per square mile
- Number of milk cows per square mile
- Number of cattle per square mile (excluding milk
cows and oxen)
- Number of swine per square mile
|
1870 Data
|
|
County
|
1
|
2
|
3
|
4
|
5
|
6
|
7
|
8
|
9
|
10
|
11
|
12
|
|
Adams
|
66
|
36
|
55
|
21
|
24
|
40
|
45
|
57
|
200
|
13
|
19
|
66
|
|
Alexander
|
45
|
124
|
9
|
12
|
15
|
43
|
79
|
8
|
23
|
2
|
3
|
21
|
|
Bond
|
35
|
34
|
60
|
18
|
35
|
30
|
56
|
1
|
105
|
10
|
13
|
45
|
|
Boone
|
46
|
34
|
76
|
17
|
41
|
23
|
34
|
1
|
82
|
25
|
28
|
28
|
|
Brown
|
40
|
23
|
29
|
48
|
22
|
44
|
62
|
3
|
19
|
7
|
16
|
53
|
|
Bureau
|
37
|
22
|
72
|
8
|
46
|
17
|
65
|
3
|
68
|
16
|
33
|
58
|
|
Calhoun
|
26
|
27
|
24
|
40
|
14
|
64
|
49
|
6
|
126
|
7
|
9
|
44
|
|
Carroll
|
38
|
40
|
66
|
10
|
45
|
23
|
50
|
3
|
44
|
18
|
33
|
59
|
|
Cass
|
31
|
2
|
39
|
14
|
50
|
20
|
79
|
0
|
6
|
6
|
17
|
34
|
|
Champaign
|
33
|
123
|
66
|
3
|
29
|
39
|
79
|
5
|
42
|
9
|
18
|
36
|
|
Christian
|
29
|
94
|
53
|
4
|
47
|
18
|
67
|
1
|
45
|
6
|
11
|
49
|
|
Clark
|
37
|
25
|
37
|
31
|
21
|
47
|
59
|
10
|
89
|
8
|
14
|
37
|
|
Clay
|
34
|
70
|
49
|
27
|
25
|
47
|
74
|
8
|
69
|
8
|
13
|
43
|
|
Clinton
|
35
|
48
|
49
|
16
|
33
|
26
|
43
|
6
|
87
|
8
|
9
|
38
|
|
Coles
|
50
|
78
|
64
|
14
|
27
|
46
|
81
|
2
|
56
|
11
|
22
|
66
|
|
Cook
|
365
|
141
|
57
|
3
|
38
|
31
|
24
|
156
|
20
|
24
|
15
|
16
|
|
Grawford
|
31
|
20
|
37
|
27
|
25
|
38
|
61
|
0
|
57
|
7
|
10
|
44
|
|
Cumberland
|
35
|
47
|
34
|
18
|
29
|
31
|
59
|
1
|
32
|
7
|
10
|
29
|
|
DeKalb
|
37
|
22
|
85
|
4
|
59
|
9
|
36
|
4
|
16
|
23
|
29
|
42
|
|
DeWitt
|
37
|
36
|
66
|
12
|
35
|
32
|
79
|
48
|
83
|
11
|
19
|
74
|
|
Douglas
|
32
|
88
|
55
|
4
|
40
|
28
|
84
|
1
|
44
|
8
|
28
|
42
|
|
Du Page
|
50
|
13
|
76
|
8
|
53
|
15
|
24
|
22
|
63
|
32
|
23
|
25
|
|
Edgar
|
34
|
27
|
67
|
17
|
32
|
46
|
78
|
0
|
98
|
11
|
33
|
62
|
|
Edwards
|
34
|
39
|
41
|
40
|
25
|
29
|
58
|
1
|
38
|
9
|
13
|
60
|
|
Effingham
|
33
|
100
|
39
|
18
|
21
|
47
|
51
|
0
|
74
|
9
|
11
|
36
|
|
Fayette
|
28
|
75
|
41
|
20
|
23
|
47
|
52
|
2
|
105
|
9
|
11
|
34
|
|
Ford
|
19
|
359
|
45
|
1
|
39
|
19
|
73
|
2
|
2
|
6
|
12
|
20
|
|
Franklin
|
31
|
34
|
30
|
2
|
13
|
64
|
66
|
20
|
90
|
8
|
14
|
62
|
|
Fulton
|
44
|
14
|
41
|
22
|
32
|
31
|
65
|
1
|
92
|
10
|
18
|
67
|
|
Gallatin
|
35
|
38
|
24
|
33
|
7
|
71
|
82
|
2
|
3
|
6
|
7
|
46
|
|
Greene
|
37
|
25
|
50
|
27
|
32
|
40
|
62
|
2
|
50
|
8
|
24
|
58
|
|
Grundy
|
35
|
44
|
72
|
2
|
48
|
8
|
50
|
3
|
7
|
16
|
30
|
20
|
|
Hamilton
|
30
|
31
|
32
|
34
|
8
|
66
|
70
|
2
|
110
|
8
|
9
|
57
|
|
Hancock
|
45
|
24
|
61
|
21
|
32
|
29
|
57
|
5
|
85
|
12
|
21
|
56
|
|
Hardin
|
28
|
36
|
24
|
39
|
12
|
65
|
74
|
0
|
2
|
6
|
8
|
45
|
|
Henderson
|
34
|
32
|
59
|
15
|
39
|
22
|
75
|
41
|
131
|
12
|
23
|
74
|
|
Henry
|
43
|
72
|
50
|
5
|
43
|
14
|
67
|
0
|
19
|
11
|
19
|
42
|
|
Iroquois
|
23
|
109
|
45
|
8
|
36
|
28
|
60
|
2
|
8
|
9
|
19
|
19
|
|
Jackson
|
33
|
105
|
21
|
23
|
8
|
68
|
56
|
6
|
113
|
5
|
7
|
45
|
|
Jasper
|
23
|
34
|
29
|
21
|
19
|
51
|
65
|
0
|
18
|
6
|
10
|
25
|
|
Jefferson
|
31
|
38
|
33
|
26
|
19
|
55
|
69
|
6
|
55
|
7
|
11
|
44
|
|
Jersey
|
40
|
25
|
39
|
22
|
34
|
33
|
45
|
1
|
98
|
8
|
21
|
43
|
|
Jo Daviess
|
46
|
2
|
41
|
21
|
26
|
35
|
52
|
11
|
79
|
17
|
30
|
57
|
50
|
County
|
1
|
2
|
3
|
4
|
5
|
6
|
7
|
8
|
9
|
10
|
11
|
12
|
|
Johnson
|
33
|
20
|
26
|
-
|
10
|
63
|
67
|
0
|
126
|
5
|
5
|
40
|
|
Kane
|
75
|
30
|
72
|
10
|
56
|
18
|
37
|
7
|
44
|
31
|
25
|
29
|
|
Kankakee
|
36
|
58
|
72
|
3
|
41
|
23
|
41
|
4
|
9
|
18
|
25
|
24
|
|
Kendall
|
39
|
-5
|
80
|
7
|
55
|
10
|
54
|
1
|
58
|
19
|
27
|
46
|
|
Knox
|
55
|
38
|
72
|
7
|
41
|
26
|
69
|
5
|
94
|
15
|
33
|
86
|
|
Lake
|
46
|
15
|
72
|
7
|
41
|
24
|
36
|
12
|
59
|
27
|
24
|
29
|
|
LaSalle
|
61
|
26
|
73
|
7
|
47
|
11
|
62
|
8
|
38
|
15
|
26
|
32
|
|
Lawrence
|
34
|
36
|
26
|
21
|
23
|
39
|
62
|
0
|
46
|
8
|
13
|
47
|
|
Lee
|
37
|
54
|
69
|
3
|
41
|
17
|
52
|
14
|
24
|
18
|
27
|
35
|
|
Livingston
|
30
|
170
|
56
|
2
|
39
|
16
|
59
|
1
|
4
|
10
|
14
|
27
|
|
Logan
|
37
|
62
|
81
|
7
|
42
|
22
|
84
|
5
|
43
|
10
|
9
|
77
|
|
Macon
|
46
|
93
|
55
|
5
|
41
|
20
|
75
|
8
|
43
|
9
|
14
|
51
|
|
Macoupin
|
38
|
33
|
53
|
15
|
44
|
23
|
44
|
3
|
40
|
8
|
14
|
37
|
|
Madison
|
61
|
41
|
55
|
19
|
26
|
39
|
56
|
96
|
99
|
11
|
8
|
72
|
|
Marion
|
36
|
62
|
37
|
13
|
.25
|
49
|
64
|
3
|
101
|
8
|
12
|
38
|
|
Marshall
|
44
|
26
|
67
|
11
|
35
|
25
|
68
|
14
|
75
|
14
|
18
|
52
|
|
Mason
|
30
|
48
|
61
|
9
|
48
|
24
|
83
|
3
|
44
|
8
|
11
|
31
|
|
Massac
|
40
|
54
|
16
|
22
|
13
|
35
|
58
|
3
|
38
|
4
|
4
|
23
|
|
McDonough
|
45
|
32
|
69
|
19
|
38
|
19
|
68
|
3
|
74
|
12
|
24
|
70
|
|
McHenry
|
39
|
7
|
59
|
6
|
36
|
30
|
44
|
17
|
42
|
27
|
24
|
35
|
|
McLean
|
46
|
88
|
67
|
5
|
47
|
16
|
75
|
10
|
45
|
10
|
23
|
52
|
|
Menard
|
37
|
22
|
67
|
17
|
37
|
34
|
86
|
0
|
71
|
11
|
32
|
86
|
|
Mercer
|
34
|
25
|
63
|
13
|
47
|
22
|
72
|
2
|
61
|
14
|
28
|
75
|
|
Monroe
|
33
|
2
|
37
|
34
|
14
|
46
|
40
|
5
|
43
|
7
|
4
|
34
|
|
Montgomery
|
36
|
83
|
61
|
11
|
31
|
40
|
52
|
6
|
58
|
9
|
11
|
49
|
|
Morgan
|
50
|
29
|
81
|
17
|
42
|
34
|
85
|
41
|
74
|
10
|
53
|
78
|
|
Moultrie
|
32
|
62
|
69
|
12
|
26
|
44
|
78
|
2
|
133
|
10
|
20
|
69
|
|
Ogle
|
36
|
20
|
65
|
9
|
56
|
11
|
61
|
9
|
27
|
17
|
29
|
44
|
|
Peoria
|
77
|
25
|
43
|
12
|
34
|
28
|
63
|
31
|
46
|
10
|
15
|
57
|
|
Perry
|
31
|
44
|
30
|
24
|
20
|
52
|
34
|
2
|
46
|
7
|
8
|
33
|
|
Piatt
|
25
|
78
|
34
|
2
|
50
|
19
|
83
|
0
|
20
|
5
|
12
|
29
|
|
Pike
|
37
|
13
|
44
|
24
|
25
|
42
|
53
|
3
|
34
|
9
|
15
|
62
|
|
Pope
|
31
|
70
|
23
|
37
|
11
|
60
|
69
|
8
|
79
|
5
|
7
|
34
|
|
Pulaski
|
43
|
121
|
9
|
6
|
7
|
72
|
76
|
108
|
140
|
4
|
7
|
28
|
|
Putnam
|
39
|
12
|
31
|
14
|
47
|
25
|
72
|
34
|
72
|
9
|
18
|
34
|
|
Randolph
|
36
|
21
|
38
|
43
|
18
|
46
|
26
|
2
|
112
|
8
|
9
|
42
|
|
Richland
|
36
|
32
|
33
|
18
|
26
|
38
|
57
|
3
|
24
|
8
|
11
|
34
|
|
Rock Island
|
70
|
42
|
57
|
12
|
32
|
33
|
71
|
39
|
163
|
18
|
30
|
63
|
|
Saline
|
33
|
36
|
29
|
29
|
8
|
74
|
78
|
2
|
9
|
8
|
9
|
53
|
|
Sangamon
|
54
|
43
|
76
|
9
|
44
|
29
|
85
|
32
|
95
|
10
|
30
|
88
|
|
Schuyler
|
40
|
19
|
34
|
22
|
21
|
40
|
55
|
0
|
73
|
10
|
19
|
54
|
|
Scott
|
42
|
16
|
53
|
28
|
37
|
35
|
73
|
3
|
35
|
9
|
24
|
69
|
|
Shelby
|
34
|
74
|
65
|
16
|
31
|
40
|
65
|
0
|
34
|
10
|
14
|
58
|
|
Stark
|
37
|
19
|
75
|
7
|
44
|
13
|
71
|
0
|
51
|
14
|
26
|
92
|
|
St. Clair
|
76
|
35
|
54
|
18
|
27
|
33
|
40
|
139
|
85
|
9
|
7
|
44
|
|
Stephenson
|
54
|
21
|
71
|
12
|
39
|
21
|
47
|
4
|
42
|
19
|
27
|
61
|
|
Tazewell
|
43
|
30
|
55
|
11
|
40
|
22
|
72
|
21
|
118
|
10
|
17
|
53
|
|
Union
|
40
|
47
|
29
|
31
|
7
|
77
|
69
|
59
|
363
|
7
|
10
|
61
|
|
Vermilion
|
34
|
90
|
63
|
9
|
26
|
51
|
78
|
3
|
64
|
11
|
26
|
58
|
|
Wabash
|
39
|
20
|
38
|
26
|
18
|
34
|
57
|
0
|
10
|
8
|
10
|
46
|
|
Warren
|
43
|
26
|
77
|
8
|
41
|
17
|
77
|
5
|
82
|
15
|
31
|
96
|
|
Washington
|
31
|
28
|
49
|
16
|
44
|
22
|
41
|
10
|
130
|
7
|
8
|
37
|
|
Wayne
|
28
|
61
|
32
|
32
|
12
|
63
|
67
|
1
|
134
|
8
|
13
|
55
|
|
White
|
34
|
36
|
29
|
25
|
11
|
58
|
74
|
0
|
54
|
7
|
8
|
50
|
|
Whiteside
|
40
|
47
|
66
|
5
|
46
|
19
|
60
|
2
|
57
|
19
|
32
|
55
|
|
Will
|
51
|
47
|
78
|
4
|
51
|
16
|
35
|
5
|
41
|
22
|
29
|
25
|
|
Williamson
|
41
|
42
|
47
|
43
|
9
|
60
|
65
|
1
|
56
|
9
|
12
|
71
|
|
Winnebago
|
57
|
20
|
73
|
11
|
46
|
19
|
45
|
38
|
92
|
2
|
31
|
38
|
|
Woodford
|
36
|
43
|
67
|
7
|
38
|
15
|
66
|
2
|
89
|
12
|
20
|
83
|
51
Objectives for Each Student
The student will:
Draw the approximate boundaries of
the Midwest region on a U.S. base
map and list those phenomena that
most significantly influence the
boundaries.
Map one category of data provided for
Illinois in 1870 using recommended
procedures.
Using the maps they have already
produced, establish, map, and justify
in writing the agricultural regions of
Illinois in 1870.
SUGGESTIONS FOR
TEACHING THE LESSON
|
Opening the Lesson
Begin the lesson by asking students to
identify the characteristics that they
associate with some region with which
they are familiar. For example, Where
is the South? The Great Plains? The
Middle East? What are the characteristics of the region? How is it distinguishable from surrounding regions?
How can you tell when you are entering or leaving the region?
Distribute outline maps of the United
States and ask students to list primary
characteristics of and draw boundaries around what they consider to be
the Midwest, first individually, then in
small groups of three or four. Display
the maps for inspection. Students will
probably find they generally agree on
a certain core of states, but disagree
about areas on the margins. Their
experiences will be similar in the following exercise on Illinois agricultural
regions in 1870.
Developing the Lesson
Assign to each student a category of
data to map. An equal number of counties
can be placed in each of four categories, or
four categories can be determined by an
equal range of data values. Students then
create maps by shading appropriate counties, using a uniform shading scheme so
that maps can be compared. Highest values
on the completed maps should jump out at
the viewer. For example, fully shade the
highest value, use crosshatching for the
second, diagonal lines for the third, and
small dots for the lowest category. Colors
enliven maps, but too many bright colors
are distracting.
Colors selected must reveal the range
of highest to lowest values at a glance.
Such maps are called choropleth maps, and
they are critical tools for geographers. This
mapping stage is fairly time consuming, but
it can be done as homework, and teachers
will find that in the process of mapping students will learn a great deal about the geography of Illinois. Mapping programs on computers can do this rapidly.
Each student-produced map should
contain TODALSIGS, the elements of good
mapmaking: T = title, 0 = orientation (minimum of a North arrow), D = date, A =
author, L = legend, S = scale, I = index, G =
grid, and S = source. Index is not necessary
in this exercise, and grid (latitude and longitude) can be noted along the map's margins
to avoid clutter.
When the maps are completed, tape
them to a wall or chalkboard, and give students a chance to examine the patterns
illustrated. Then ask students to look for
relationships by identifying areas where
several patterns correspond. Are areas
where corn dominates also those that have
little woodland and have experienced rapid
population growth? Does farm size differ
from north to south? Why? Do the areas
settled at an early date differ from those settled later?
52
Distribute to each student a copy of the
Illinois Physiographic Regions map and
briefly describe the categories it displays.
Ask students: How do their maps correspond with the map of physical regions?
What does the information tell about the
relationship between farmers and the environment? What advantages or disadvantages were posed by location and the environment? How were the disadvantages
overcome? How does your particular county
fit into the overall pattern? Is your county
similar to or dissimilar from its neighbors?
Do not fall into the trap of thinking that
physiographic regions must correspond with
agricultural regions in any exact way.
Once students have explored those
questions, arrange students in groups of
three or four, and instruct each group to create its own overall map, which will be titled
Agricultural Regions of Illinois in 1870. Five
to eight regions of varying sizes should be
identified. Each should have its own
descriptive name, should consist of several
characteristics that seem to belong together,
and be accompanied by a written defense.
Tape the completed maps to the chalkboard
for inspection.
Concluding the Lesson
Lead a discussion of students' ideas
about Illinois regions. What are the merits of
the various maps produced? What problems
were encountered? How were they
resolved? Can the class agree on one
regional classification system? Could similar
techniques be used to create regions for
larger areas of the world?
Extending the Lesson
The answers to these questions could
provide the basis for greater in-depth studies, either for individuals or for the class.
Students could be asked to assume the
roles of young men or women sent west to
look for new farms to purchase in 1870.
After traveling the state, they must write letters to their families explaining what they
have seen in various parts of the state and
why they are recommending particular
places for new homes.
Assessing Student Learning
Choropleth maps can be collected for a
grade, but the agricultural regions maps and
accompanying rationales are better for the
purpose of evaluating students' understanding of the concept region. Subjective observations of students working in groups on
agricultural regions may also provide insight
to student understanding.
53
54
Click Here to return to the Article
55
|