|
SCHAUMBURG'S GIS PUZZLE
By GARY PETERSON, Village of Schaumburg, GIS Coordinator
Geographic Information Systems (GIS) are being
implemented by an ever increasing number of cities
and municipalities throughout the country, all seeking
to take advantage of this latest technology to streamline
their operations. CISs have been highly touted as a
means to increase productivity and efficiency by organizing work flows, eliminating redundancies, linking
departments and agencies together, organizing records, databases, and documents by linking them to
spatial features, and performing a variety of spatial
analysis queries.
In 1990, the Village of Schaumburg commissioned a
feasibility study to determine the costs and benefits of
implementing a GIS. The results of the study indicated
that Schaumburg could save an estimated 20% of its
geographic related cost by implementing a GIS. The
study also revealed what staff was already painfully
aware: The mapped records, maintained primarily on
paper, Mylar, and microfilm, proved bulky to handle,
time consuming to update, and deficient in accuracy
and completeness. Duplication of effort between departments was also evident in several areas relating to
maintenance of both graphic and tabular data.
Schaumburg subsequently began implementing
GIS. To reduce initial implementation costs, yet still
begin to gain the benefits of a GIS, a phased approach
to implementation was chosen. The key to Schaumburg's phased approach lies in the GIS acronym itself. A
GIS is like a puzzle with many components or pieces to
be assembled. The "G" in GIS, which stands for Geographic, was the first piece of the puzzle. In keeping
with this, initial efforts were channeled into developing
the geographic portion of the database.
The first phase of developing the geographic data
included capturing planimetric (surface) features for
approximately 19 square miles. As recommended in the
GIS study, Schaumburg chose aerial photography as
the method for capturing this data. A photogrammetric
firm, Geonex, Inc., was contracted to produce the aerial
"ortho" photographs and to digitize planimetric features from the "orthos." The features included streets,
sidewalks, parking lots, driveways, building outlines,
and surface utilities. Two foot interval contours were
also generated from the orthos by means of extensive
ground control survey.
As utility infrastructure inventory and maintenance
will make up a significant portion of the GIS, it was
critical that the utility information gathered be as complete and accurate as possible. Therefore, prior to the
aerial photography being "flown," Schaumburg Public
Works crews pre-marked the esisting surface utility
features (manholes, hydrants, etc.) by painting symbols
on or around them. This made it possible to identify
these features on the aerial photography. The aerial
photography was flown in April of 1992, and the subsequent hard copy and digital products were delivered
over the next three years.
To utilize and manipulate the digital data delivered,
Schaumburg needed to acquire the necessary hardware
and software. Research by staff lead to the recommendation and purchase of hardware and software from
Intergraph Corporation. In November of 1993, a single
"standalone" workstation, along with a large format
scanner and an inkjet plotter, was installed within the
Engineering Department. Software included Intergraph's Modular GIS Environment products along with
Microstation as the CAD "engine."
Once the Automated Mapping/GIS Workstation
became operational, initial emphasis was placed on
developing utility infrastructure data. The utility premarking mentioned above proved to be a highly successful means of capturing accurate locations of surface
utility features from the aerials. However, since underground utility lines obviously could not be seen on
aerial photography, a decision had to be made as to the
method for capturing these also. Schaumburg chose to
perform this task in-house, and the method developed
for doing so turned out to be quite simple, yet effective:
With the surface features already present, the operator
merely refers to existing "as-built" plans and performs a
"connect the dots" process to digitize the underground
utilities. Areas constructed after the aerial photography
was taken are captured by scanning and digitizing the
drawings using an on-screen or "heads-up" method.
February 1996 / Illinois Municipal Review / Page 21
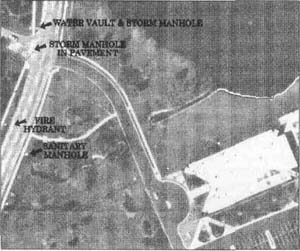
Aeiral photograph of a portion of the Village of Schaumburg's
Robert O. Atcher Municipal Center.
(Note the painted surface utilities.)
|
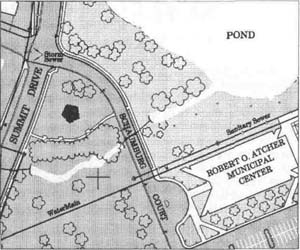
Plot of the planimetric data of the same area compiled from
the aerial photograph.
|
Schaumburg began initial mapping of underground
utilities late in 1994, and expects to complete this process early 1997 utilizing one workstation. This is truly
amazing when compared to the fact that it originally
took one drafter approximately seven years to complete these maps using manual methods. Not only does
the new System allow for faster completion, but it also
provides for quicker and more accurate updates.
One of the first uses for the planimetric and utility
data involved the preparation of graphic maps and
exhibits. Many such maps and exhibits, such as those for
Village Board meetings, have been generated on the
workstation. For example, at the time this article was
written, maps were generated for Public Works crews
looking for accurate locations of water valves in order
to service an emergency water main break.
The next letter in GIS, "I", gives us a clue as to the
next phase of Schaumburg's project - the linking of
non-graphic tabular "I"nformation to the spatial geographic data. It is said that 75% of all the information
compiled by a municipality is geographic in nature. In
other words it can be linked to known geographic locations. Schaumburg is no exception to this. In fact, while
Schaumburg was developing the geographic map data
described above, it was also developing non-graphic
informational databases on its existing PC and data
processing network. Included within these databases
are those that comprise a master property information
database with Property Identification Numbers
(P.I.N.s) being the common link. Schaumburg is currently testing its GIS software to link this data to the
graphic base.
The benefits of linking informational data to graphic features are many. For one, it organizes the data so
that it is readily available, easily located and accessed.
As with most, if not all municipalities, Schaumburg
employees have always found it necessary to go
through a variety of operations to locate information.
Whether it be wading through mountains of old ar-
Page 22 / Illinois Municipal Review / February 1996
chived records and files, searching through rolls and
rolls of microfilm, or tapping the memory of the "lifer"
employee who has been around for twenty or thirty
years. Another benefit is that GIS software allows the
user to manipulate the information and run queries
and/or "what-if" scenarios. The results of these queries
are displayed graphically, making for effective visual
interpretation of the data and the query results.
To complete the breakdown of the GIS acronym,
we come to the "S" as the final piece in the puzzle. It is
Schaumburg's goal to expand the GIS into a Villagewide "S"ystem with each department linked into its
graphic and non-graphic data. In this way each Department will share in the benefit of this technology.
Each Department will also be responsible for maintaining its specific information within the system and thereby contribute to the total information available to the
users. Just a few of the potential benefits to some of the
departments are as follows:
Public Works officials will be able to use the
system to create and maintain inventories and
maintenance histories of Village water and sewer
infrastructure.
Village planners will be aided in the preparation
of concept plans and land use studies. They will
also be able to perform a variety of spatial analysis queries to support their planning and decision
making processes.
The Engineering Department will use the system
to produce and maintain maps and exhibits, and
to create engineering design plans for public improvement projects. The system will also aide
daily inspections, and incident and complaint
tracking.
The Building and Health Departments will be
aided in the areas of permit and inspection tracking, and address matching and geocoding.
The Police and Fire Departments may eventually
be linked to the system to support their efforts in
crime analysis, response studies, beat planning,
hazardous material locations, emergency preparedness, and 911 operations.
Up to this point Schaumburg's "one-piece-at-a-time" approach to GIS implementation has been a successful one. The Village of Schaumburg is very excited
about putting all of the pieces of its CIS puzzle together
to create a fully functional Geographic Information
System.
February 1996 / Illinois Municipal Review / Page 23
|