this assumption. Using this logic, we can understand how Norridge could have a profitable facility with a population of 31,000 spread over only three square miles (3,279 per mile). Yet we cannot understand how tiny Lemont with a population of 15,000 spread over more than 32 square miles could also be profitable.
We could also assume that aquatic facilities in more affluent communities are more likely to be profitable and the study did provide some support for this assumption. Denying that the affluence of a community's population relates to how much money gets spent on recreation is difficult. Yet, the affluence may also work to the disadvantage of a recreation agency. People with more money to spend on recreation also are more mobile. They may take advantage of facilities in neighboring communities while poorer people may be limited to the recreation resources near their homes. Wealthier communities also have more choices of aquatic facilities, such as private clubs, home pools, apartment and condominium pools and pools at high schools.
Drawing absolute conclusions from a single study of such complex issues as this is difficult. So many factors affect the profitability of aquatic facilities, some so impossible to quantify that it is unlikely any research can pinpoint them all. Yet, the complexity of profitability is in itself a vety important conclusion to draw from this study. This study makes it clear that there no single factor guarantees it. We may also conclude that contemporary facility design is not the panacea the available literature would have us believe.
Findings Suggest Three Strategies
Yet, the study suggested three general strategies that are important considerations for any agency building or remodeling a facility. The first consideration is to reduce costs per unit of service. Obviously, a recreation facility that serves many people at a small cost per person is more likely to be successful than one whose cost per person served is very high. Likewise, the more revenue a facility can extract from each unit of service the more likely their success. In aquatic facilities the best measure of a unit of service is admissions. Each time a person walks through the gate they are receiving a measure of service from the facility and the facility is incurring expense in providing that service.
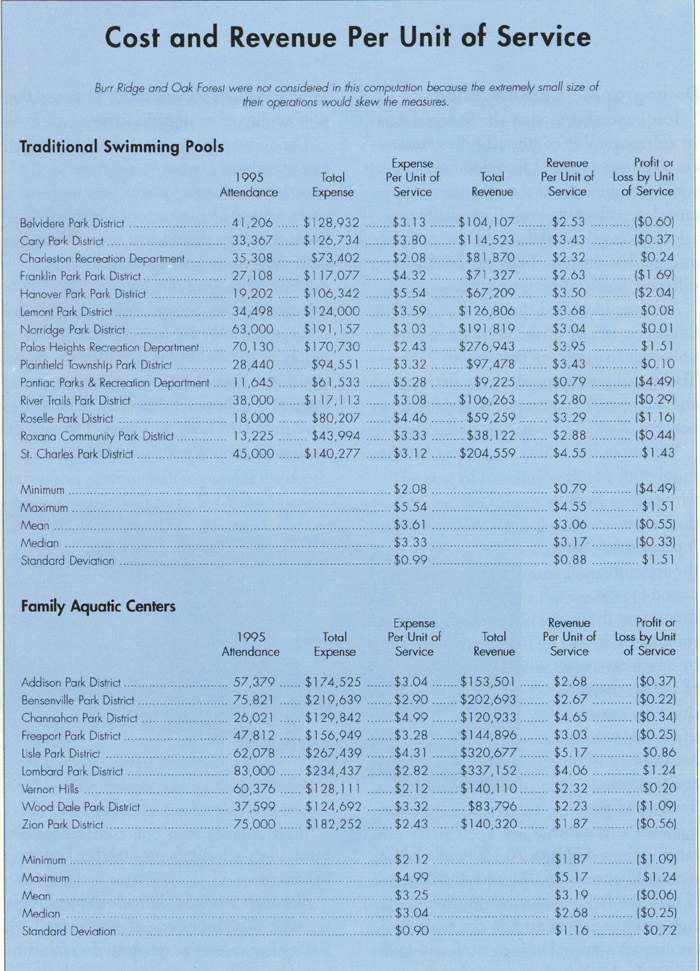
The table above shows the cost per unit of service computed by dividing the total number of people calculated this figure served in 1995 by the total cost of serving those people. The table also shows the revenue per unit of service for each facility in the study. Even when eliminating the two extreme cases, Burr Ridge and Oak Forest, the FACs had lower mean costs per unit and higher mean revenues per unit than traditional pools.
In these terms, the difference between surplus and loss is easier to swallow. Wood Dale, for example, could have turned its 1995 loss into a break-even operation by bringing in around 18,000 more admissions without significantly increasing expenses. On its face this may sound like a hard adjustment, but Wood Dale's facility has a very large capacity. An increase in attendance of an extra 100 to 200 admissions a day might require only a few additional staff and some additional utility expense.
When examined for cost per unit of service and revenue per unit of service the advantage of FACs becomes more apparent. Their generally larger capacity permits FACs to absorb larger numbers without incurring greater expense. This ability is directly related to design features.
